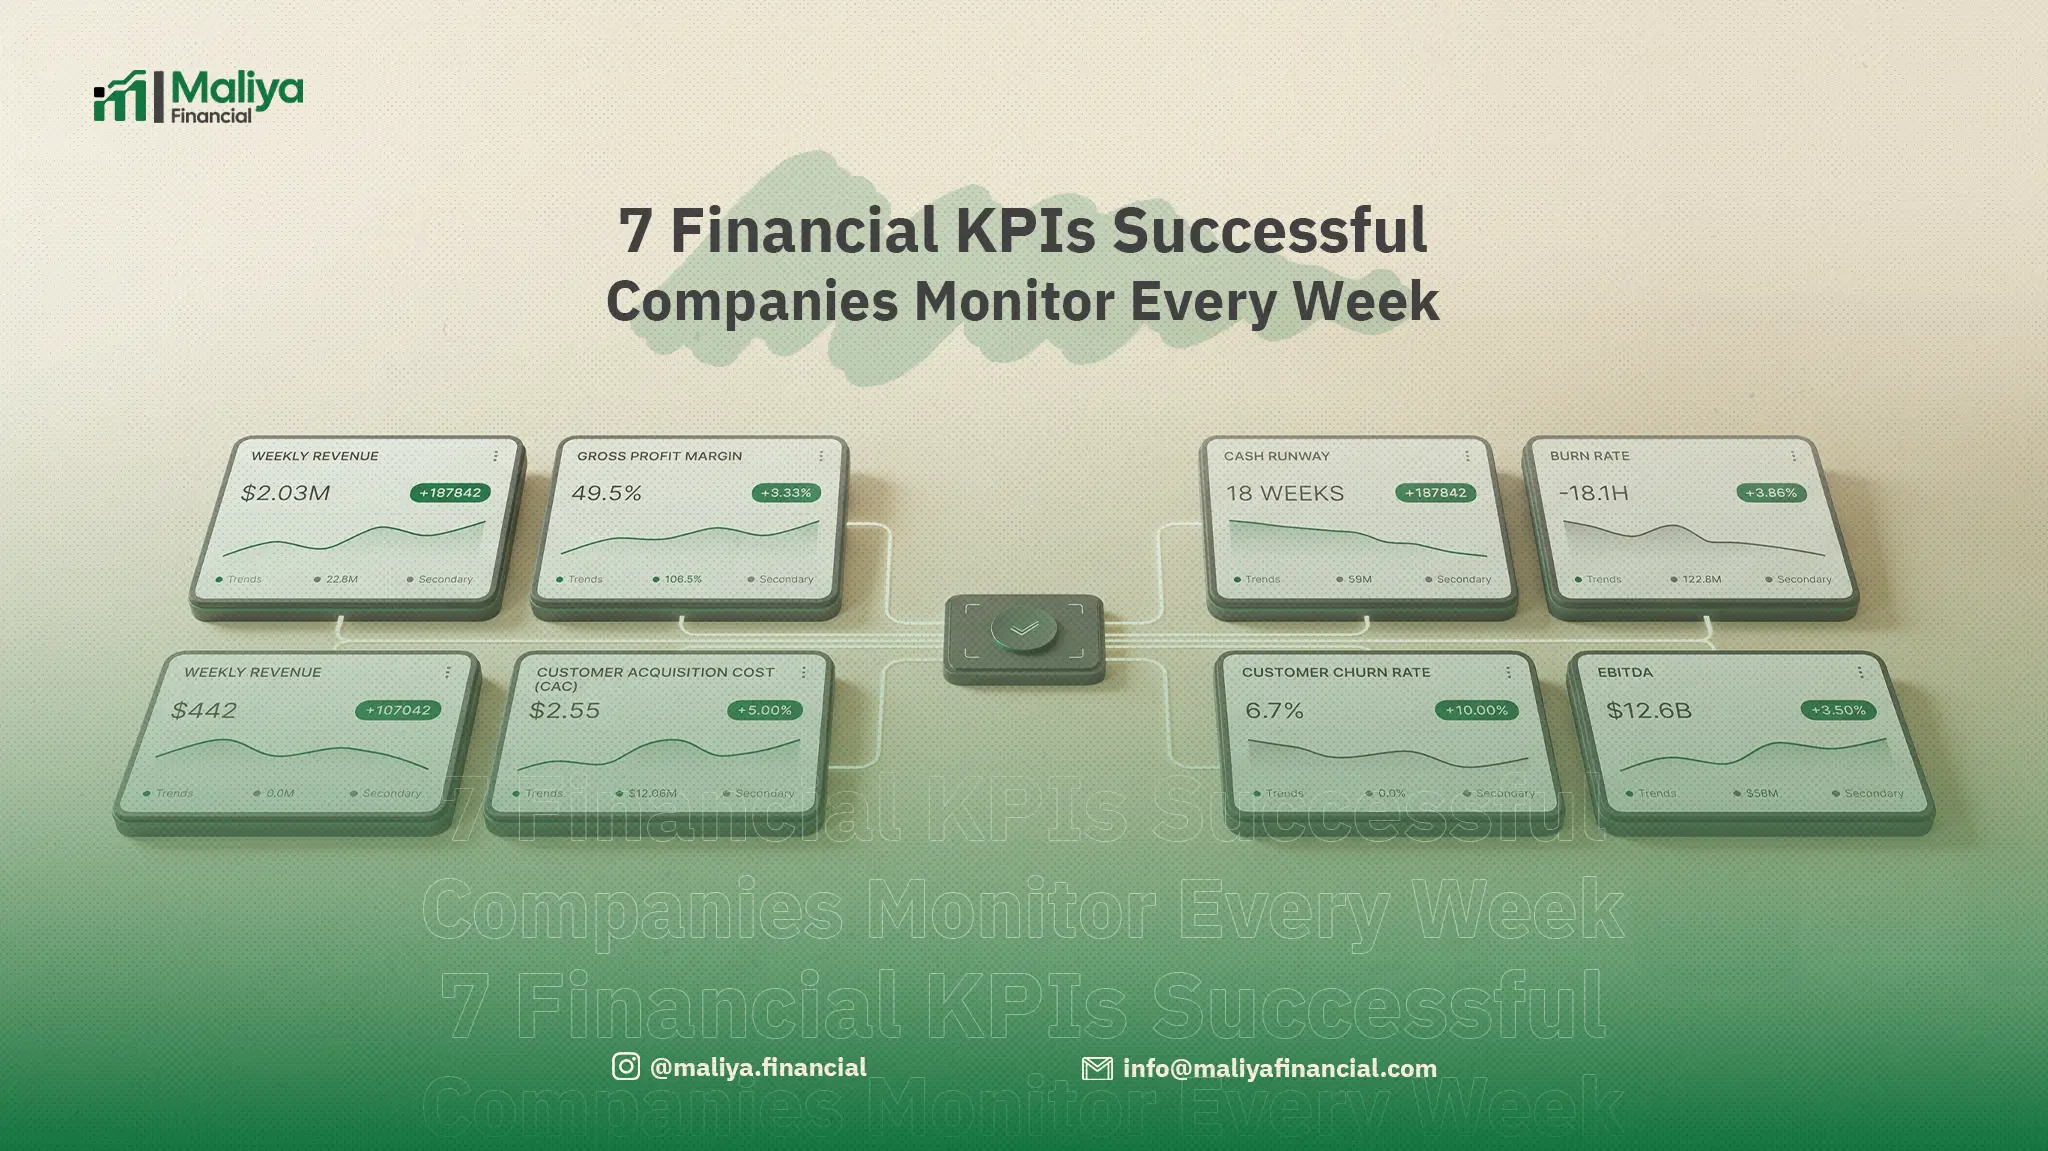
7 Financial KPIs Successful Companies Monitor Every Week
A complete guide to understanding your business financial dashboard maliyafinancial.com
Introduction: Why Profit Alone Isn’t Enough
Most business owners fall into the same trap: they obsess over the monthly profit figure and ignore dozens of other signals telling them the real story of their business. A company can generate massive sales and still collapse — if its numbers aren’t managed correctly.
Real financial success isn’t about revenue size. It’s about understanding the language of numbers. That language is what separates companies that grow sustainably from those that grow chaotically and then decline.
In this article, we break down 7 essential financial KPIs that successful companies use to monitor their performance every week — with formulas, healthy benchmarks, and real-world examples.
1. Quick Ratio
Formula: (Current Assets − Inventory) ÷ Current Liabilities
What it measures: Your ability to pay urgent debts without needing to sell your inventory.
Healthy Benchmark
A ratio of 1.0 or higher is ideal. Below 1.0 means the company may struggle to meet its short-term obligations.
Real-World Example
A trading company with current assets of AED 500,000, inventory of AED 150,000, and current liabilities of AED 200,000:
Quick Ratio = (500,000 − 150,000) ÷ 200,000 = 1.75 ✓ — Very healthy position.
Why It Matters
- Reveals whether the business is living on debt
- Warns you of a liquidity crisis weeks before it happens
- Essential when negotiating with banks or investors
2. Inventory Turnover
Formula: Cost of Goods Sold ÷ Average Inventory
What it measures: How many times you sold through your entire inventory over a given period — typically a year.
Reading the Results
- High ratio: Product is in demand, liquidity is good, storage costs are low
- Low ratio: Money is frozen on shelves, risk of expiry, added costs
Real-World Example
An electronics store with COGS of AED 1,200,000 and average inventory of AED 300,000:
Inventory Turnover = 1,200,000 ÷ 300,000 = 4× — inventory sold 4 times per year.
Compare this to the industry average: if competitors achieve 8×, there’s a problem that needs addressing.
3. Average Collection Period
Formula: (Accounts Receivable ÷ Sales) × 365
What it measures: How many days you wait to collect your money from customers after completing a sale.
Healthy Benchmark
The general benchmark is under 30 days. The shorter the period, the better your liquidity. Your money should be in your account — not your customers’.
Why It Matters
- A profitable company on paper can collapse due to slow collections
- Helps identify consistently late-paying clients
- Directly tied to your daily cash flow
Real-World Example
A contracting company with accounts receivable of AED 600,000 and annual sales of AED 3,000,000:
ACP = (600,000 ÷ 3,000,000) × 365 = 73 days — a red flag that demands a credit policy review.
4. Debt-to-Equity Ratio
Formula: Total Debt ÷ Shareholders’ Equity
What it measures: How your company finances its assets — through its own capital or through debt.
Healthy Benchmark
A ratio below 2.0 is generally acceptable. Higher means the company dangerously relies on debt to fund its assets — increasing financial risk.
Reading the Numbers
- D/E = 0.5: 1 unit of debt for every 2 of equity — excellent
- D/E = 1.0: Balanced debt and equity — acceptable
- D/E = 3.0: Debt is 3× equity — high risk
Context Matters
Some sectors like real estate and banking naturally operate with higher debt ratios. Always compare against your industry average, not a universal absolute standard.
5. Operating Profit Margin
Formula: (Operating Profit ÷ Revenue) × 100
What it measures: The profitability of your core business activity — before interest and taxes.
Why It’s the Most Honest Metric
Net profit can be distorted by taxes and one-time events. Operating margin gives you the clean picture of how efficient your actual operations are.
Industry Benchmarks
- Retail: 3%–8% — normal for the sector
- Software: 15%–30% — high margins due to cost structure
- Financial services: 20%–40% — excellent margins
- Restaurants: 5%–15% — varies by location and management
Real-World Example
A tech company with revenue of AED 2,000,000 and operating profit of AED 400,000:
Operating Margin = (400,000 ÷ 2,000,000) × 100 = 20% — excellent performance in tech.
6. Return on Assets (ROA)
Formula: (Net Profit ÷ Total Assets) × 100
What it measures: How effectively your assets generate profit — this is your true investment efficiency.
Healthy Benchmark
An ROA above 5% is generally considered good. The higher it is, the more efficiently the company uses its assets to generate profit.
Real-World Example
A logistics company with net profit of AED 300,000 and total assets of AED 5,000,000:
ROA = (300,000 ÷ 5,000,000) × 100 = 6% — acceptable for an asset-heavy sector.
ROA vs. ROE
- ROA: Efficiency of total assets (equity + debt)
- ROE: Return on shareholders’ funds only
- ROE is always higher than ROA due to the effect of financial leverage
7. Break-Even Point
Formula: Fixed Costs ÷ (Price − Variable Cost per Unit)
What it measures: The number of units — or revenue volume — at which you cover all your costs. Everything beyond this point is pure profit.
Formula Components
- Fixed costs: Rent, salaries, subscriptions — don’t change with production volume
- Variable cost: Cost of producing each additional unit
- Contribution margin: Price minus variable cost
Real-World Example
A restaurant with monthly fixed costs of AED 50,000, average bill of AED 100, and variable cost of AED 40 per bill:
Break-Even = 50,000 ÷ (100 − 40) = 834 bills per month
The restaurant needs just 834 customers per month to cover costs. Everything after that is profit.
Uses of Break-Even Analysis
- Price products and services with intention
- Evaluate the viability of a new venture before launch
- Set a minimum sales target for your team
Summary: Your 7-KPI Dashboard
| KPI | English Name | Healthy Benchmark | What It Tells You |
|---|---|---|---|
| Quick Ratio | Quick Ratio | > 1.0 | Sufficient liquidity to pay debts |
| Inventory Turnover | Inventory Turnover | Varies by sector | Product demand and cash health |
| Collection Period | Avg Collection Period | < 30 days | How fast your money returns |
| Debt-to-Equity | Debt-to-Equity | < 2.0 | Financial stability level |
| Operating Margin | Operating Profit Margin | Varies by sector | Core operations efficiency |
| Return on Assets | ROA | > 5% | How well assets generate profit |
| Break-Even Point | Break-Even Point | Minimum sales target | Where real profit begins |
Conclusion: Build Your Financial Dashboard
These seven KPIs aren’t just accounting numbers — they are the language of your business. Each one tells a different story: liquidity tells you whether you’ll survive this month, inventory turnover tells you whether your product is moving, and collection period tells you whether your clients are paying on time.
Successful companies don’t wait until year-end to read their numbers. They monitor weekly, act immediately, and build decisions on data — not assumptions.
Start today by calculating these KPIs for your own business. If you find a metric outside the healthy range, that’s not a cause for alarm — it’s an opportunity to improve.
For more simplified financial content — maliyafinancial.com | @maliya.financial